I sold my three positions in Proshares Ultra Silver ETF (AGQ) this afternoon. I am experimenting with having my FreeStockCharts screen provide me numerous tabs set to various time frames ranging from the Daily time frame sequentially down to the 15 minute time frame. I think this will be a new area for growth in my understanding of the True Strength Index (TSI) and Money Flow Index (MFI) indicators - learning to be able to discern the importance of signals given in one time frame vs. their implication in another.
*
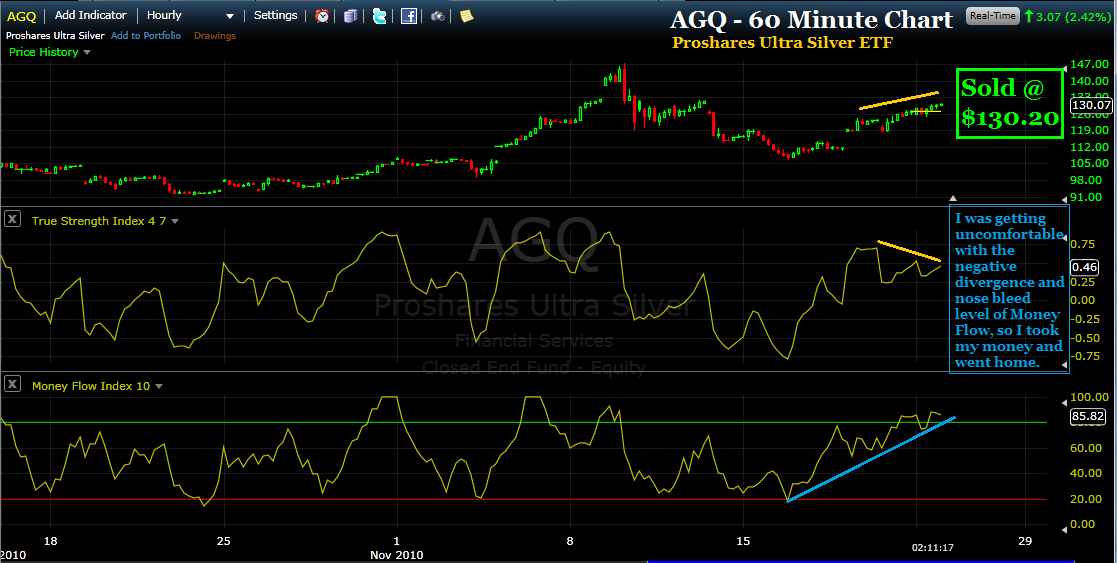
Click on the charts to ENLARGE
*
It's going to take me a while until I get enough experience using this screen setup so that the mistakes will be fewer and farther between. For now, I just have to expect the mistakes and learn as I go. I bet you know that feeling, right?

So here are charts of my two sales that cleared out my entire AGQ holding. It turns out that AGQ just continued higher after my sales, so obviously my timing was less than optimal. But I am learning a new system and I forgive myself in advance for experiencing these kind of issues. One day I hope to somewhat master how all the different time frames 'speak' and then I will add another notch to my belt.
*
My TSI Trading record has been updated.
*
My cumulative record has now surpassed 500% for the past 5 months - 509.9%.
*
Also, the actual 'value' of my trading account has increased 84.78% in this time frame since beginning this blog.

![[Most Recent Quotes from www.kitco.com]](http://www.kitconet.com/images/quotes_special.gif)


No comments:
Post a Comment